Economists find that two children from the same family income can face vastly different futures based solely on which side of town they grew up on.
Based on: Chetty, Raj, John N. Friedman, Nathaniel Hendren, Maggie R. Jones, and Sonya R. Porter. 2026. “The Opportunity Atlas: Mapping the Childhood Roots of Social Mobility.” American Economic Review 116 (1): 1–51. Working paper version available via NBER.
The research, in slides
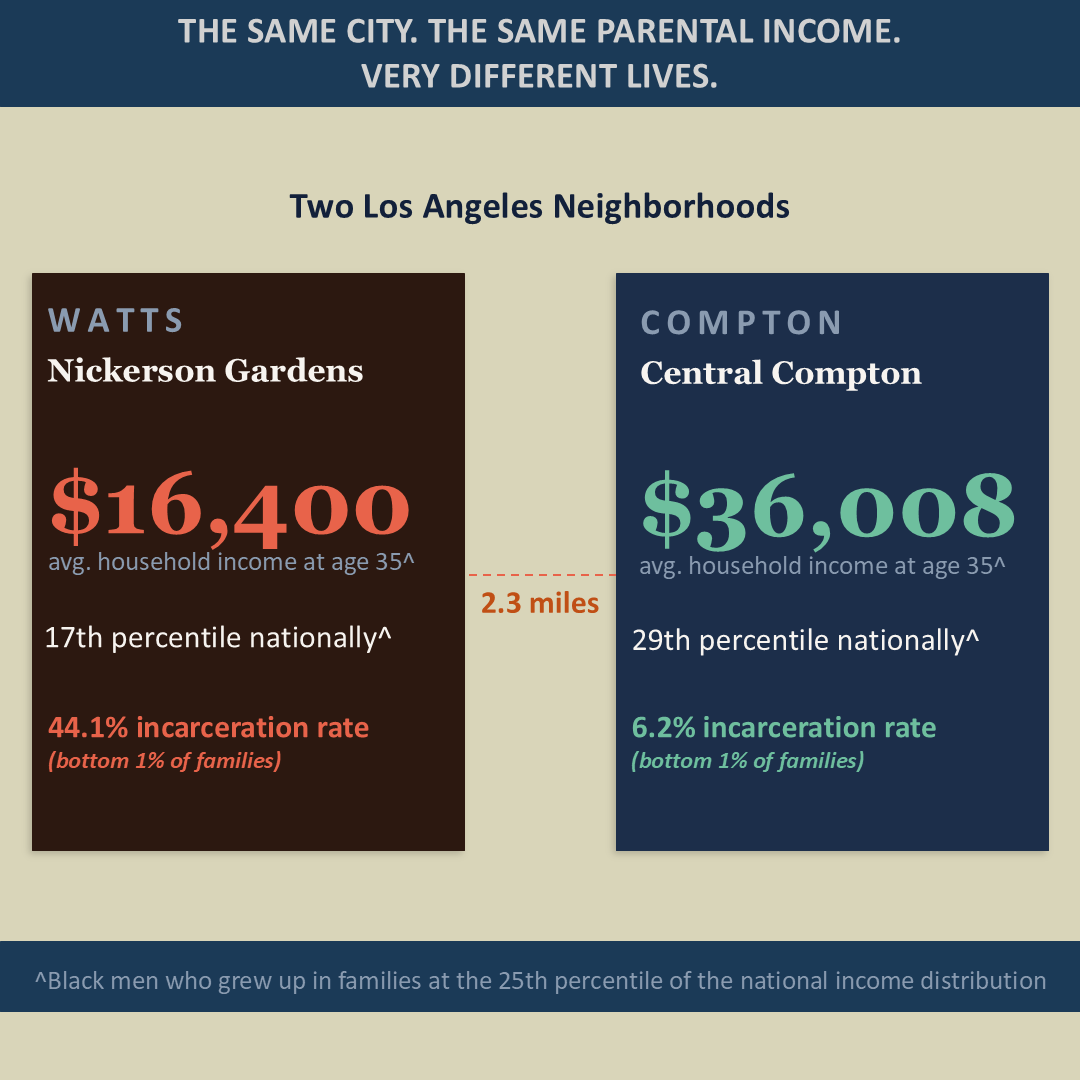
Watts and Compton are geographically close. The outcomes are not.
Nickerson Gardens is a public housing project in Watts, a neighborhood in central Los Angeles. Two miles and change to the south sits Compton. In most conversations about urban poverty, these two places get mentioned in the same breath. Economically, they’re treated as interchangeable. But economist Raj Chetty and his team of researchers show they shouldn’t be.
Black men who grew up in low-income families in Watts’s Nickerson Gardens tract land at the 17th percentile of the national household income distribution by their mid-thirties, with average household incomes of $16,400 a year. Black men who grew up in comparable low-income families just 2.3 miles south, in central Compton, reach the 29th percentile, with average household incomes of $36,008. Same race, same parental income starting point, similar proximity to downtown LA, but different neighborhood and more than twice the income.
The incarceration numbers are starker still. Of Black men from the very poorest families in Watts, 44.1% were incarcerated, according to the 2010 Census. In central Compton, that number was 6.2%. This is not a modest difference; it is a total divergence of life paths for children starting from the exact same economic rung.
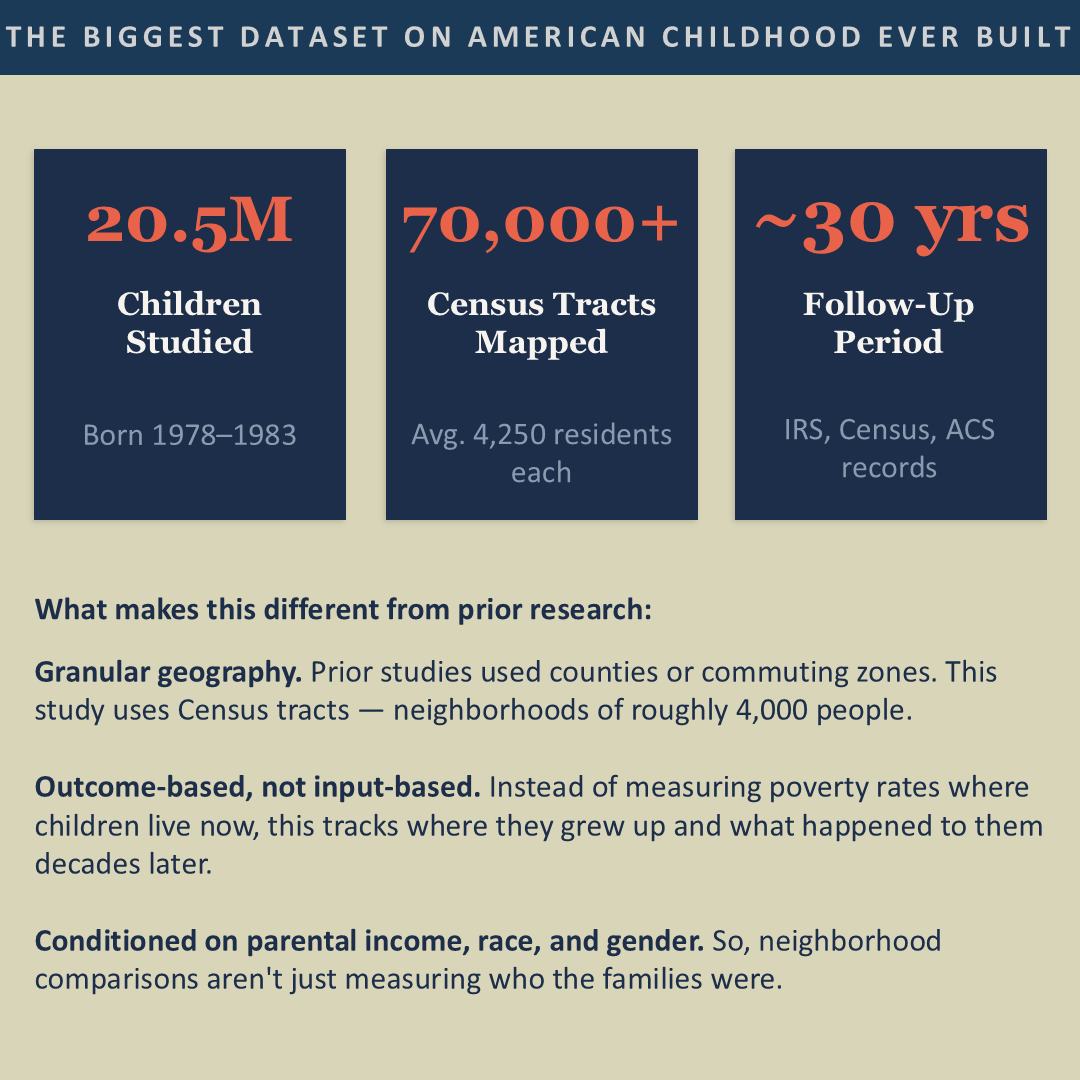
This is a story of about 20.5 million children, studied across the entire United States, and what the data say about how profoundly the neighborhood shapes the child.
What the Opportunity Atlas actually is
This paper constructs what authors call the Opportunity Atlas: a publicly accessible dataset that estimates children’s long-term outcomes by the Census tract where they grew up. A Census tract is small, with an average of about 4,250 residents. So, this is granular in a way that prior research has not been.
The outcomes are measured decades later. The children studied were born between 1978 and 1983. Their adult incomes, incarceration rates, marriage rates, and rates of teenage birth were measured between ages 31 and 37, using IRS tax records, Census data, and the American Community Survey, all linked through the Census Bureau. The dataset covers roughly 96% of U.S. children in those birth cohorts.
To isolate how much the neighborhood contributes to life milestones and outcomes, the analysis controls some of the more prominent factors such as parental income, race, and gender. So, when the paper compares Watts to Compton, it’s comparing Black men raised at the same rung of the parental income ladder, not different rungs.
It’s not just those two neighborhoods. The variation is everywhere.
Imagine two families living in the same county, both earning about $27,000 a year. You might think their children have the same shot at success because they live in the same general area, play at the same parks, have access to the same libraries, or shop at the same stores. However, these data show that the specific neighborhood (Census tract) where a child grows up has a huge impact on their future paycheck. Move a child from a low-income family from a typical low-opportunity neighborhood to a typical high-opportunity one in the same county, and you’d expect their adult household income to differ by roughly $10,000 every single year.
This isn’t comparing a poor rural town to a wealthy suburb; this is the gap between neighborhoods just a few miles apart. Even after accounting for parental income, race, and gender, the specific Census tract where a child grows up explains substantial additional variation in adult outcomes, so much so that traditional proxies like poverty rates capture only about half the story.
What is interesting is that this is not just another way of saying that ‘poor’ neighborhoods have worse outcomes. You might think a neighborhood’s poverty rate would tell the whole story, but the data show that poverty only explains about half of why these kids’ lives turn out so differently. The Opportunity Atlas uncovers the other half of the story, revealing a hidden map of opportunity and success that traditional statistics have been missing for decades.
The method, plain English
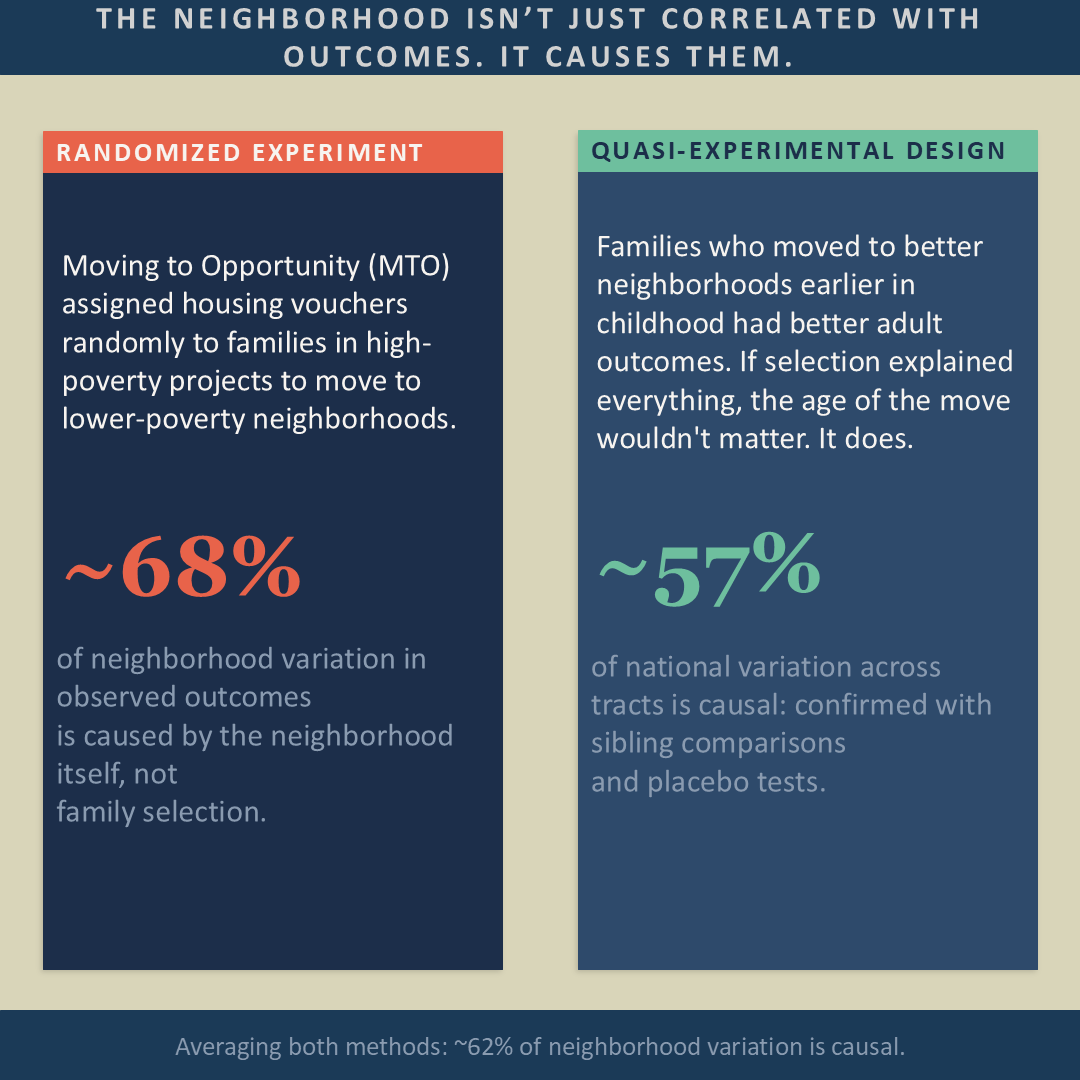
The core question of this paper is whether certain neighborhoods produce better results for children because of the neighborhood itself (a causal effect) or simply because different types of families choose to live there (selection). To solve this, the researchers used two distinct methods to see if “place” really matters.
Method 1: The “Random Lottery” (MTO Experiment)
The researchers first looked at the Moving to Opportunity (MTO) experiment. In this study, low-income families were randomly assigned housing vouchers through a lottery to move to lower-poverty neighborhoods.
Because the move was determined by a lottery rather than family choice, it eliminated the “selection” problem, i.e., the families who moved weren’t necessarily “more motivated” or “wealthier” than those who stayed; they were just luckier. The data showed that if the Opportunity Atlas predicted a neighborhood would give a child a $1,000 boost in future annual income, a child who was randomly moved there actually received $680 of that boost. This suggests that 68% of the difference between neighborhoods is a genuine causal effect of the location.
Method 2: The Timing of the Move (“Movers” Design)
The second approach looked at millions of families who moved between neighborhoods on their own. The researchers focused on the child’s age at the time of the move. The logic is simple: if a neighborhood’s success were just about the ‘type’ of family, it shouldn’t matter whether a child moved there at age 2 or 20, because they would have the same parents either way. However, the data showed that the earlier a child moves to a better neighborhood, the larger the benefit to their future success. This “exposure” effect implies that about 57% of the variation in outcomes across neighborhoods is due to the neighborhoods themselves, not just the families who live there.
Double-Checking the Results
To make sure these findings were solid, the authors performed several “stress tests”. They compared siblings within the same family who moved at different ages to ensure family-wide factors weren’t skewing the data.
They also looked at birth outcomes (like birth weight) for children before their families moved. They found that kids moving to “better” neighborhoods weren’t “healthier” at birth than those moving to “worse” ones, suggesting that the benefits only started appearing after they arrived in the new neighborhood.
The Bottom Line: By averaging these methods, the researchers concluded that roughly 62% of the variation in children’s outcomes across neighborhoods is caused by the environment of the neighborhood itself.
What actually helps kids succeed? (it’s not what you might expect)
Many people assume that to help children succeed, we need to bring more businesses and offices into their neighborhoods. This is based on a theory called “spatial mismatch”—the idea that kids struggle simply because they live too far away from where the jobs are.
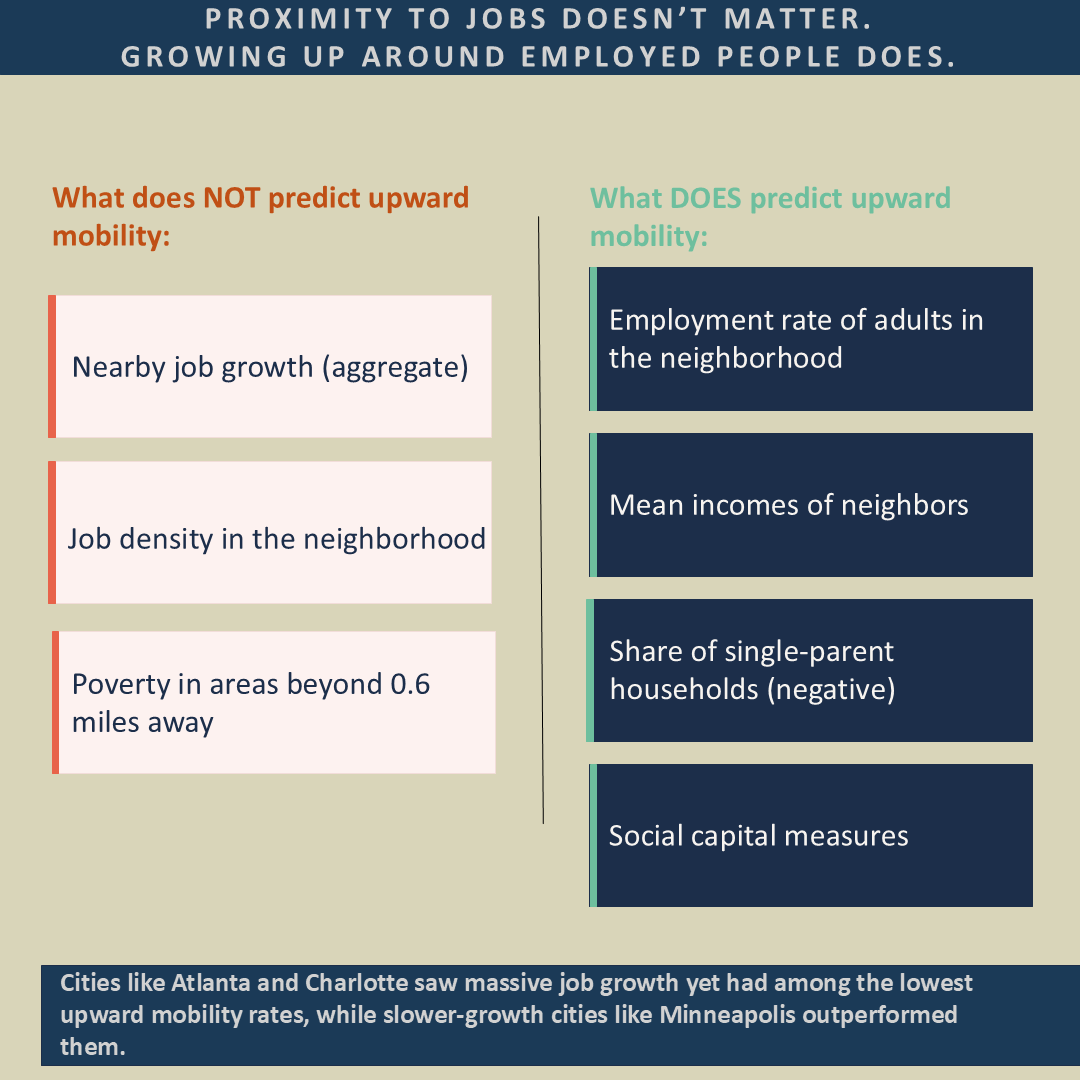
The data tell a different story. Having more jobs nearby doesn’t help. In fact, having a high density of jobs right in a neighborhood is actually slightly bad for a child’s future. City-wide job growth doesn’t help, either. Cities like Atlanta and Charlotte have seen massive job growth, yet they still have some of the lowest rates of kids moving up the income ladder
What actually predicts success is who lives in the neighborhood. Instead of being near office buildings, kids need to be near people who work. A child’s future income is much higher if they grow up around adults who have steady jobs, live in two-parent households, and are part of a community where neighbors look out for one another (often called “social capital”).
This environment matters at an incredibly local level. The researchers found that the poverty rate of a broader city or even a nearby area has almost no effect on a child. What truly shapes a child’s future is their immediate neighborhood, specifically the environment within about 0.6 miles (roughly within a 10-minute walk) of their front door. Once you go further than that, the neighborhood’s influence basically disappears.
Moving to opportunity is cheaper than you’d think
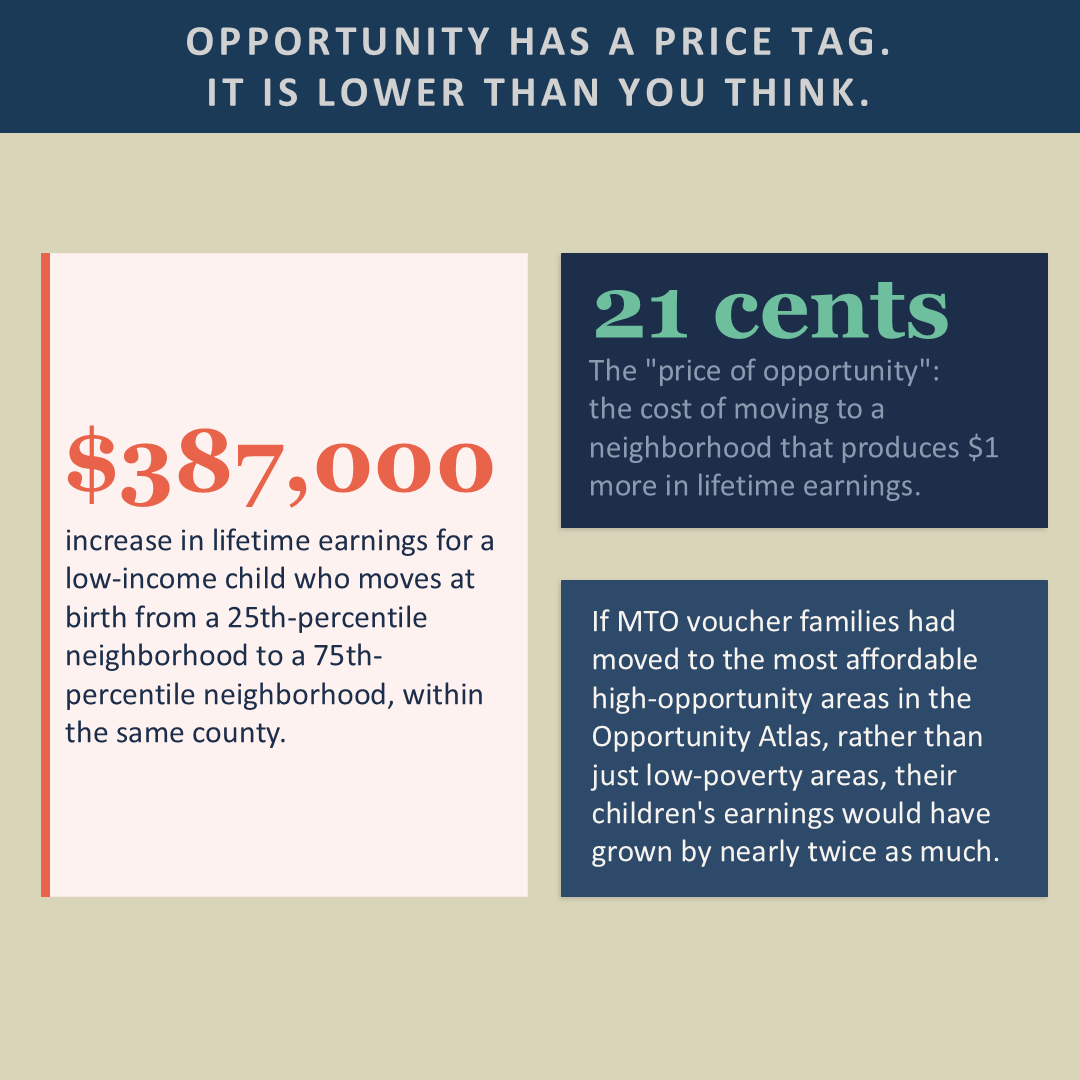
For low-income families, the “price of opportunity”, i.e., the cost of moving to a neighborhood that produces $1 more in a child’s lifetime earnings, in present value, is 21 cents.
Put differently, in most cities, it is feasible to find neighborhoods that produce better outcomes for children at rents comparable to or lower than where families currently live. Housing voucher recipients right now live in neighborhoods with substantially worse upward mobility prospects than other neighborhoods with similar rents.
The paper calculates that if a child moves at birth from a neighborhood in the bottom quartile (25th percentile) of opportunity to one in the top quartile (75th percentile) within the same county, they are projected to earn an additional $387,000 over their lifetime. This is a causal estimate, meaning the move itself creates the additional earnings, based on the ‘Movers’ study of millions of families.
If the families who received vouchers in the MTO experiment had been guided to the most affordable high-opportunity neighborhoods in the Opportunity Atlas data, rather than just any low-poverty neighborhood, their children’s earnings would have increased by nearly twice as much as they actually did.
The caveats
While the Opportunity Atlas is a breakthrough, it has a few important limitations:
The core analysis follows children born between 1978 and 1983, measuring their incomes in their mid-thirties. Neighborhood conditions change, and outcomes for children born today may differ from those in the Opportunity Atlas. The paper addresses this directly and the researchers found that opportunity is very stable: the best and worst neighborhoods 30 years ago are usually still the best and worst today. So, the Atlas remains informative, but it’s not a real-time measurement.
In very small neighborhoods or for small groups of people, the data can be “noisy,” meaning a single person’s outcome could swing the average. The researchers were careful to double-check their most shocking findings, like the gap between Watts and Compton, using a second group of younger children to show the results were real and not just a statistical fluke.
The Opportunity Atlas is incredible at pinpointing exactly where kids succeed, but it doesn’t yet prove exactly why. It might be the schools, it might be the safety of the streets, or it might be the friends they make. Scientists are now using this map as a starting point to researching those deeper questions.
This study focuses entirely on the United States. While similar patterns have been seen in places like Australia and Canada, every country has different systems for schools and housing that might change how these neighborhood effects work.
So, what?
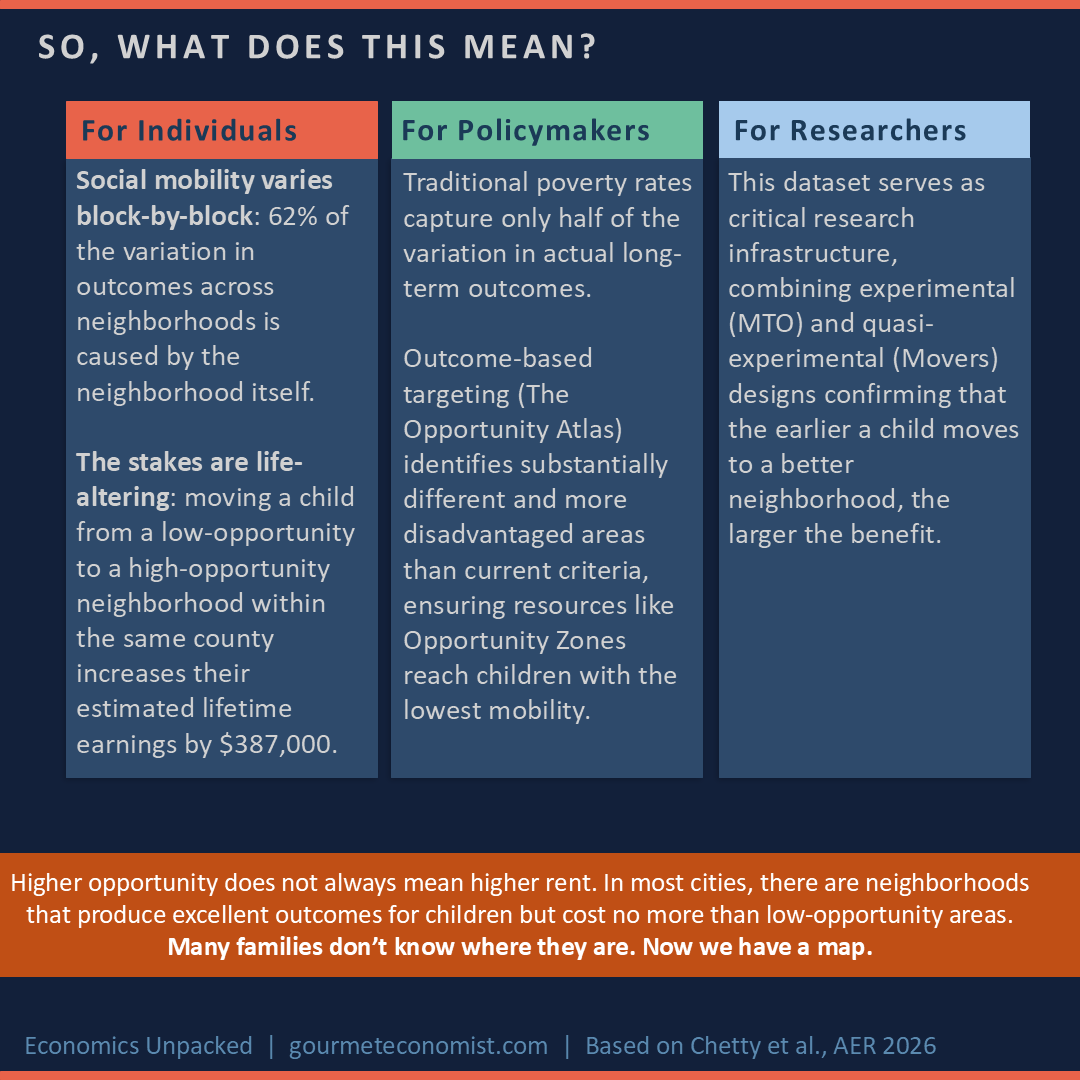
For the individual: For anyone who grew up in a neighborhood and wondered how much it shaped where they ended up, the answer, drawn from 20.5 million data points, is: a lot. This study shows that childhood “soil” has a massive causal effect on adult success, determining roughly 62% of the variation in outcomes across neighborhoods. These effects are so profound that moving a child from a low-opportunity to a high-opportunity neighborhood within the same county can increase their lifetime earnings by an estimated $387,000.
For the policy maker: For those in housing and education policy, the Opportunity Atlas is a direct challenge to the proxies currently used to target resources. Programs like Opportunity Zones and Head Start centers are often set using poverty rates or aggregate disadvantage measures. However, the data show that traditional poverty measures capture only about half of the neighborhood-level variation in outcomes. If these programs were instead targeted using the Opportunity Atlas’s outcome-based estimates, the neighborhoods chosen would be substantially different and would have substantially worse baseline outcomes, ensuring resources flow to the children who actually need them most.
For the researcher: Methodologically, the paper provides a gold standard for attributing causality to place. By combining the randomized experimental validation of the Moving to Opportunity (MTO) study with a quasi-experimental “movers” design that tracks the timing of family moves, the authors isolate the genuine impact of the environment from the characteristics of the families who live there. The public release of this granular, tract-level data, broken down by race, gender, and parent income, serves as a critical piece of research infrastructure that is already fueling new studies on everything from pollution to historical redlining.
The Big Idea: The “price of opportunity” is surprisingly low; in most cities, there are “opportunity bargains”, neighborhoods that produce excellent results for kids but cost no more in rent than low-opportunity areas. Many families currently live in areas with poor prospects simply because they lack this data. Zip codes are not destiny, but they are data, and now that we have better data, we have a better map to change that destiny.